How exploration reports have become key assets in Google Analytics 4
As Google Analytics 4 (GA4) takes centre stage as the primary analytics tool, it’s crucial that we understand its new features and maximise their potential. The exploration report feature is fully customisable, which allows you to tailor your reports to your needs. In this blog we discuss how to use exploration reports to get greater insight and understanding of your data. If you require support with GA4, we’re here to assist you.
What are the different types of exploration reports?
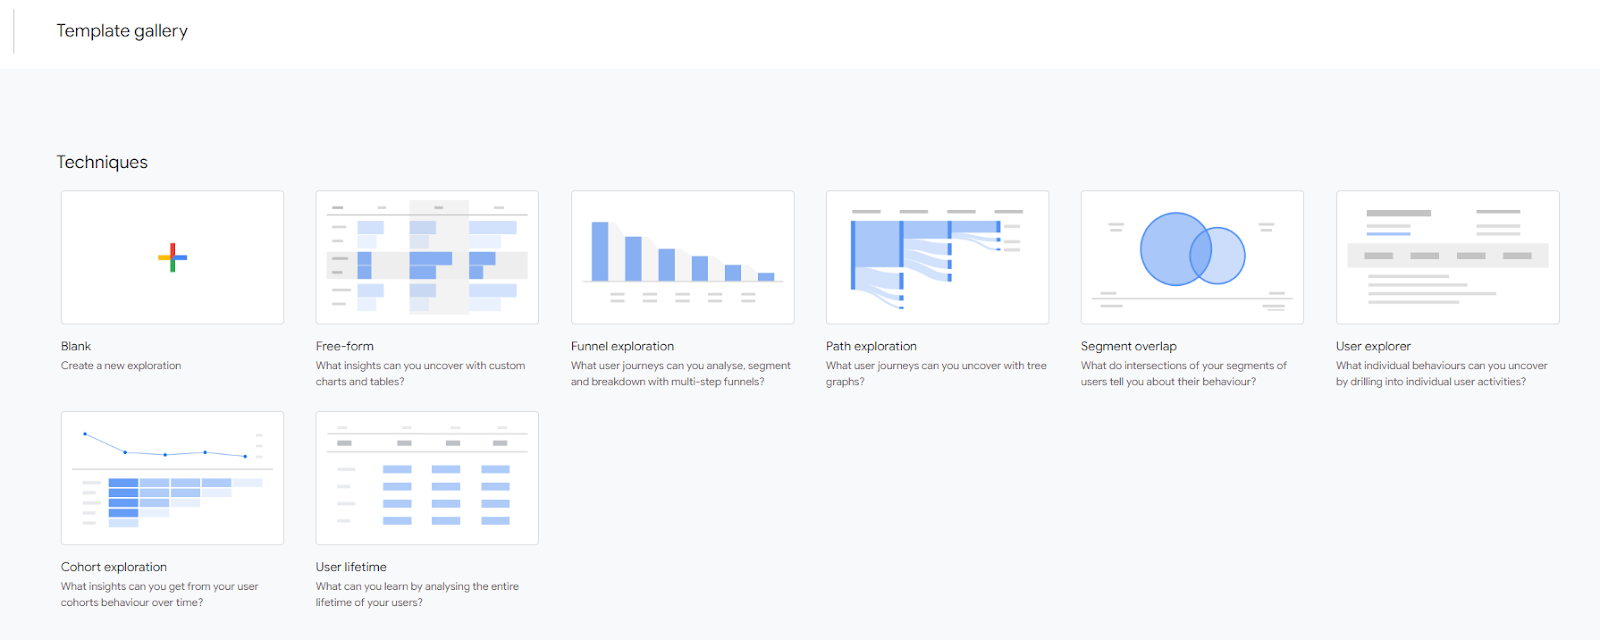
There are seven different types of exploration reports that are available within GA4, these are:
- Free-form exploration – Examine your data using a recognisable crosstab format.
- Cohort exploration – Obtain valuable observations from the actions and efficiency of user groups sharing common characteristics.
- Funnel expiration – Envision the processes users follow to accomplish tasks on your website or app, and analyse key drop off points throughout the user journey.
- Segment overlap – Explore the connections between various user segments.
- User exploration – Analyse the users comprising the segments that you create.
- Path exploration – Envision the routes your users follow while engaging with your website and application.
- User lifetime – Investigate customer behaviour and assess their value throughout their entire journey with your website.
Navigating exploration reports effectively
If you’re new to explorations they can be quite difficult to navigate. There are four important areas within explorations that will make it easier to analyse your data, and allow you to make better decisions. The four points we’re going to touch are: dimensions, metrics, filters and segments.
Dimensions
Dimensions refer to data attributes or traits that offer extra insights into your website’s users and their interactions with the site. There 315 dimensions to choose from, so Google has provided context behind each one which can be seen here. Some of the most common dimensions that we use include:
- Session default channel group
- Landing page + query string
- Session source
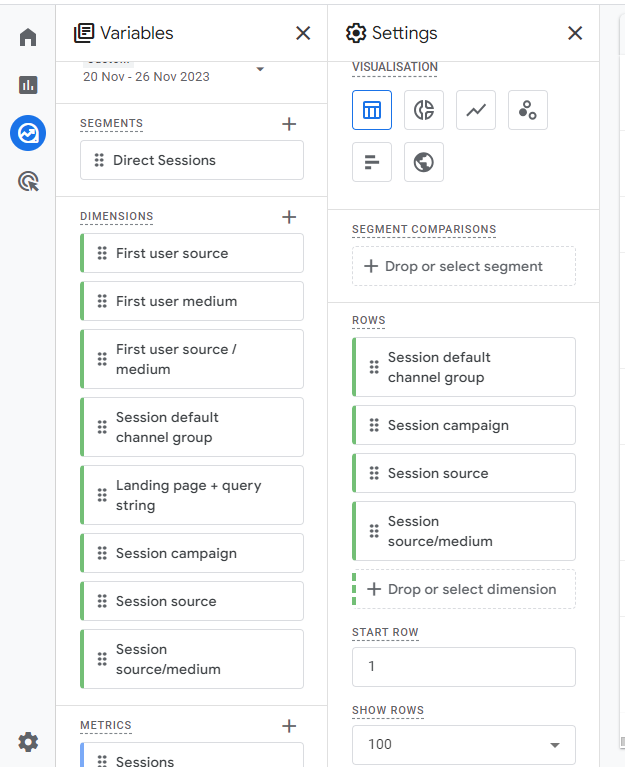
To add dimensions you will need to hit the ‘+’ icon and then select your desired dimensions. Once they appear in the ‘Variables’ side panel you can then drag and drop them into the ‘Settings’ side panel.
Metrics
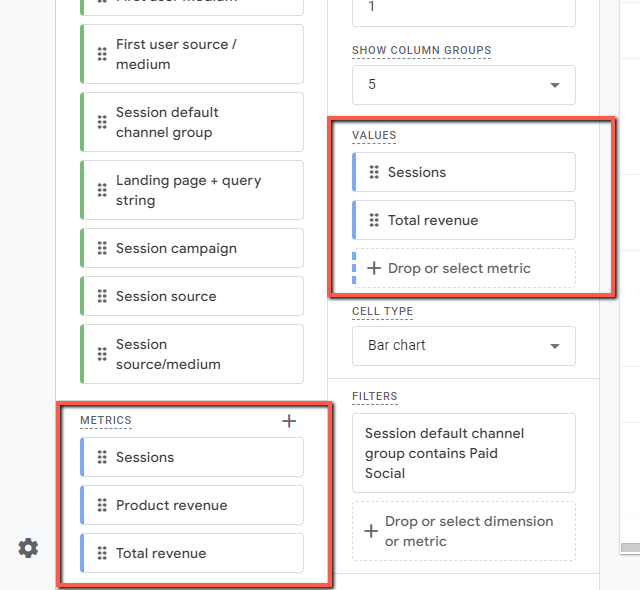
A metric constitutes a numerical gauge, encompassing averages, ratios, percentages, and similar quantitative measurements. Similarly to dimensions, there are 169 metrics to choose from, so referring back to Google’s documentation is crucial. Selecting your desired metrics allows you to discover and better analyse your website’s data. Plus, metrics can help you gain an overview of data you already know but need clarification on, for example revenue numbers generated from different channels (paid ads, paid social, etc).
Filters
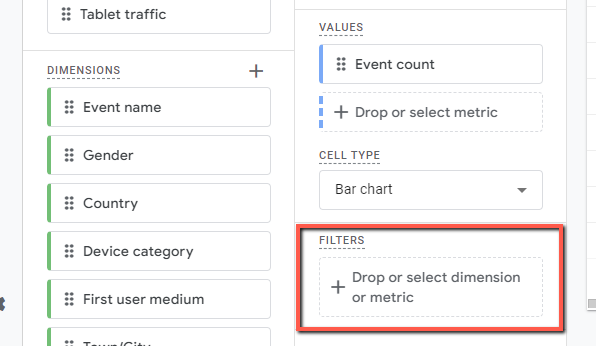
Filters allow you to include or exclude data from your reports. Understanding how to use filters will help refine your data further. You can use the filter feature on dimensions, metrics or both. Some common uses of filters include filtering for Organic traffic, or filtering Paid traffic. The only limitation with filters is that you can apply up to 10 filters per tab, but if you’re just starting off, one filter should be enough to refine your data to see what you want.
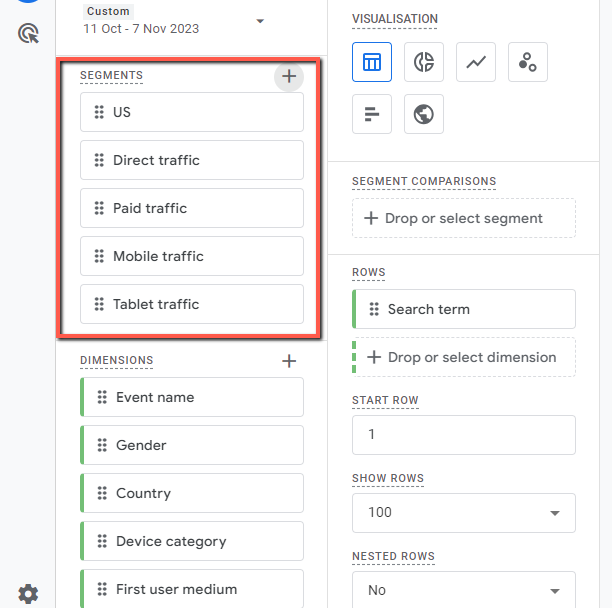
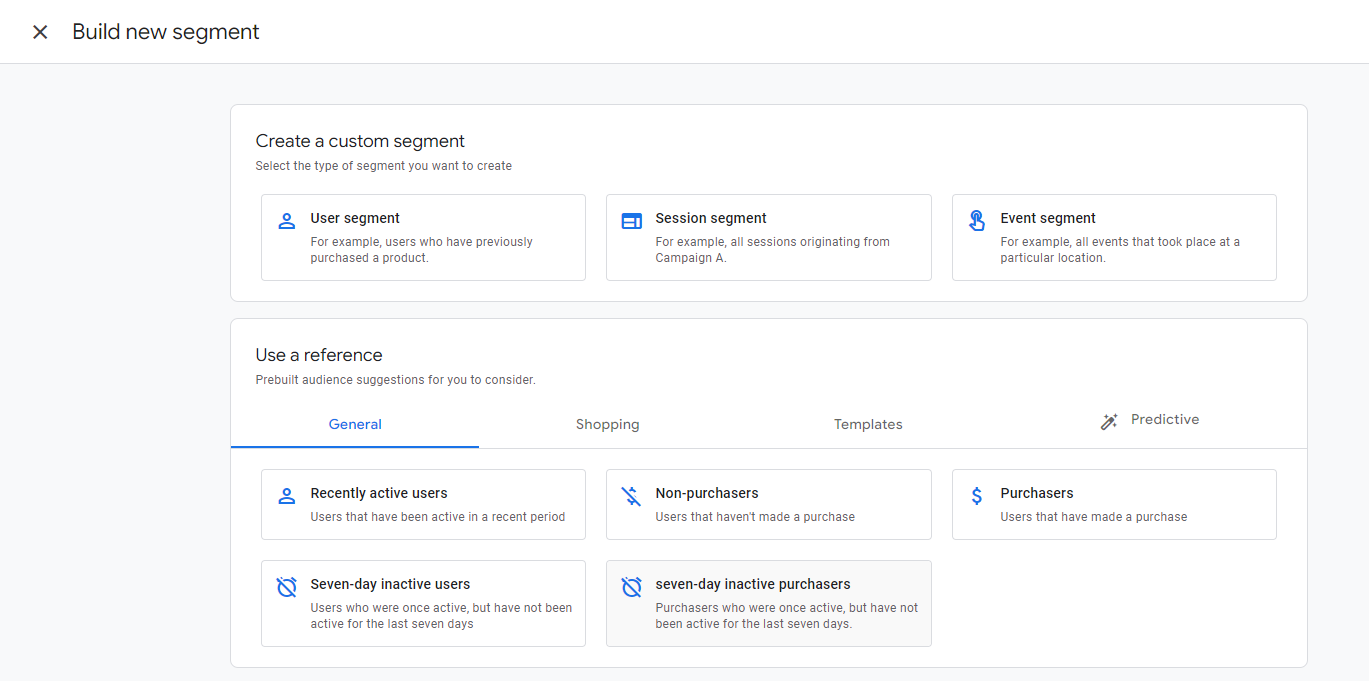
Segments
In Universal Analytics, segments were a big feature that was used throughout the platform. However in GA4, explorations are the only place where segments can be utilised. Segments can help you to interpret a subset of data according to certain criteria which can drive business decisions. In explorations you can create either a user segment, a session segment or an event segment, with the event segment being a new addition to GA4. Experimenting with segments is one of the best ways to get familiar with these features and see where the potential lies. For example, you can create a segment that looks at users from a particular country or city.
What exploration reports can you build to give you a better insight into your data?
As mentioned, there are seven different types of explorations reports that can be used in GA4, but applying these with data can be the tricky part. We would recommend to start with the free-form report as this has a similar layout to the standard reports found in GA4.
One example of an exploration you can build is a landing page report specifically for your most important pages. Although this can be done in the main reports, having a specific exploration for those pages allows you to quickly jump into GA4 and gather the data you need, while also having the ability to look at more than two dimensions, something that isn’t possible in the standard landing page report. In addition, you can customise your dimensions and metrics to refine the data.
Another exploration report we would recommend starting with is the path exploration report. This report will help you understand how users navigate your site and shows which journey paths they take to get to specific pages. This is especially useful to see the user flow through the website before conversion. It will also show if there’s a high drop-off rate on a certain page which can highlight areas for improvement.
Overall, explorations are a fairly unused feature due to its absence in Universal Analytics, but this isn’t a bad thing. We’ve provided some great insights to our client’s websites which have only led to positive conversations. If you’re new to explorations we recommend going in and having a closer look. We provide GA4 training sessions to help your business discover hidden insights that may improve the user experience and conversion rate. If you need any further consultancy or analytics support we’re here to help.
Want cutting-edge digital news and tips straight to your inbox? Sign up to our monthly newsletter here
"*" indicates required fields