Maximising Content ROI: GA4 Metrics and Performance Analysis
In a fast-moving digital environment where users demand answers and become greatly impatient, your content must serve your audience well. This can also be an area that differentiates you from the rest – educating your readership, addressing pain points and elevating your expertise throughout your content production. But, once your content is live, the next phase is the most important:
- How can you understand the impact your website content is making?
- How can we showcase ROI from our content strategy?
- Is there content potentially bloating and diluting our keyword visibility?
- Which pieces of content are contributing to conversions?
The Universal Analytics approach is now outdated
Over the years with Universal Analytics, we’ve been used to reporting on metrics like Bounce Rate, Time on Page or Unique Page Views to gauge the effectiveness of our content. And of course, there are other metrics that are more useful than the ones above, but for UA, it was our way of approaching content analysis.
Enter GA4. An entirely new platform and interface in which many businesses and marketing teams are now lost in. In this guide, we’ll go through some of the most popular metrics and areas of GA4 you can utilise to shape a clearer picture of your content performance and whether it’s making the desired impact following your planned strategy.
The metrics that you need to take into account
It’s worth noting that most metrics are there for guideline analysis, and there are other sources you may be using to identify stronger narratives such as Google Search Console, but we have to start somewhere with GA4.
Engagement Rate – this is the inversion of the beloved ‘Bounce Rate’. Essentially, we’re assessing how engaged users were when reading your content. You’d imagine an engagement rate between 60%-70% is naturally strong and worth benchmarking against.
Unique user scrolls – scroll tracking is now part of the automated event rollout in GA4 and is part of ‘Enhanced Measurement’. This metric aligns well with general engagement, but you can dive into how far down specific user groups navigate on that particular blog post, for example. See the image below on where this is currently located:
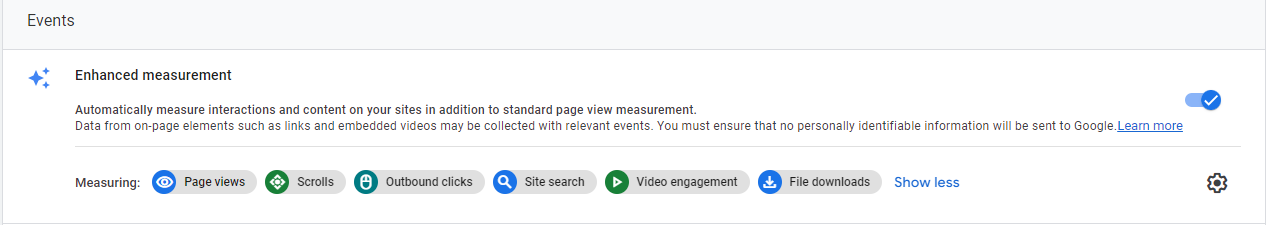
Admin > Data Streams > Enhanced Measurement
Conversions – most notably remembered as ‘Goals’ in Universal Analytics, conversions, if set up correctly, can shape your analysis and cement clearer conversion paths that users might be taking stemming from your content.
Users – an important metric to find those unique readers. Total Users was a metric developed in Universal Analytics, but now GA4 has coined ‘Active Users’, which basically means users who are actively engaged in your content. This helps with refinement rather than starting with a wealth of broad data.
Being creative in your Exploration Reports
Explorations are a popular feature in Google Analytics 4, as this is your home to create bespoke reports for your business. There are a number of different types of reports you can create in terms of display and data collection.
Getting to know Free Form Reports
A popular Exploration report is ‘Free Form’, which allows you to bring together dimensions and metrics in a table like format, which you can effectively build out and turn into a content marketing comprehensive report.
An example might be that you want to analyse your website blog performance and how this contributes to your website revenue:
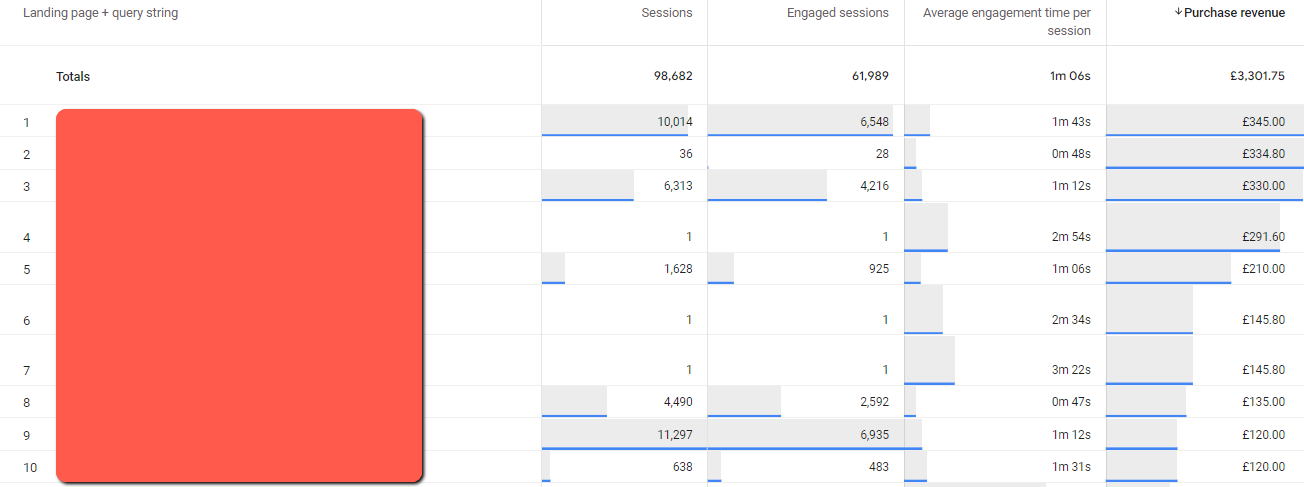
The above image has been filtered by revenue, and it’s worth noting that landing page revenue is another guideline metric as there are many touchpoints from entrance to conversion, but it still shows value in how that user started their journey.
Follow the Path Exploration journey
Path Explorations are another great asset where you can review the touchpoints and overall journey a user has made from start to finish. This is useful for marketing teams if they’re keen to find user frustrations or popular conversion paths. You have total control when creating these Path Explorations – there are two options, a Start Node or an End Node.

Start node – your report will start from this specific page or area, depending on what filter you apply.
*Our tip* – use the start node on your blog posts or commercial pages to gauge where users visit next and if there is an established trend in their journey. Do they also revert back to their starting position, which could show a case of an unfulfilled user experience.
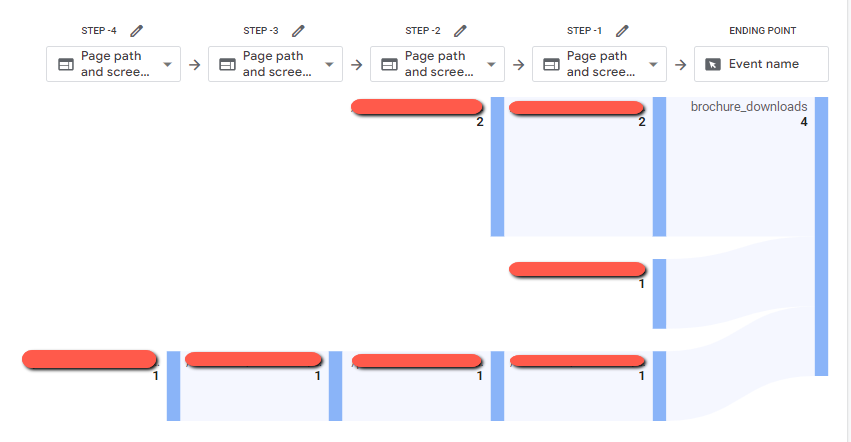
End node – your report will be reverse engineered and will run backwards from that specific event or page you requested.
*Our tip* – use the end point for a specific that your business cares about, i.e. Brochure Download, Form Completion etc and work backwards from there. Select ‘Page Path & Screen Class’ for the other pages, and you’ll quickly see the conversion journeys that were made.
Customise your profile to access key reports quicker
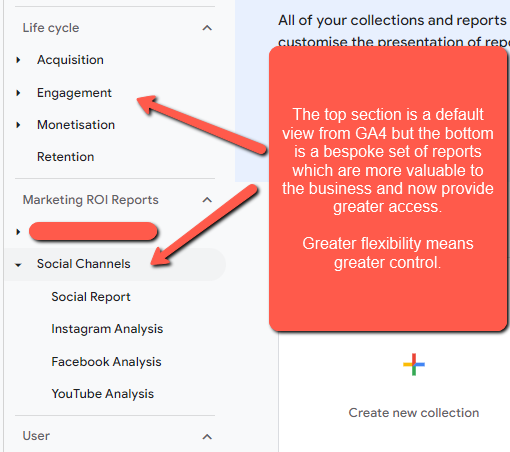
One of the biggest benefits of GA4 is the ability to customise your sidebar using the ‘Library’ function so you can design your interface around your KPIs. This is useful as it reduces the need to go deep into Analytics and find what you’re looking for.
By using the ‘Library’ function, you’ll be able to set the rules and automated filters you need to access valuable data at a far quicker rate.
An example could be a business that heavily operates across social media and wants to further analyse each channel and understand how campaigns are performing. Setting the required filters in your Library will provide you with new reports dedicated to that social channel – some examples are below:
Lifting insights into a master dashboard
Utilising dashboards like Looker Studio makes analysis a lot more efficient as all insights are purely lifted straight from Google Analytics 4. This is a time-saver and is also a great tool for marketing teams to use on a daily/weekly/monthly basis as you have complete autonomy in terms of setting date ranges, selecting specific channels and more, but it is dependent on how these dashboards are set up.
At Distinctly, we use Looker Studio across client reporting but also integrate this if any business is embarking on a new GA4 journey. This also plays a key role in a training capacity and when you’re looking to upskill a team as they now have a dashboard that is futureproofed, lifting key insights tailored to their KPIs and is also branded to the business.
An example of how this might look can be found below:
To Summarise
We appreciate that GA4 is new to many businesses, and there are some frustrations along the way, but utilising specific areas that add significant value is our recommendation. Spending time on creating reports and customising your property is not only going to save time, but it’s a future-proofing exercise as you and your wider team can upskill together and identify what content is performing and why. As you become more familiar with GA4 and the metrics they use for measuring content performance, it will make your analysis and your upward communication a lot smoother as you have the bespoke reports to back up your thinking.
If you are having difficulty with Google Analytics 4 and require further training, then we’re happy to support you.
Want cutting-edge digital news and tips straight to your inbox? Sign up to our monthly newsletter here
"*" indicates required fields