Heatmaps for SEO – A surefire way to level up your SEO strategy
Heat maps are used in a variety of ways across different industries, with heat maps for SEO commonly used as a graphical visualisation method showcasing user behaviour on a website — be it a landing page or product page.
Alongside this, the conundrum of conversion rate optimisation (CRO) and overall site optimisation is a task many an SEO team have grappled with, ensuring they can ideate strategies to improve this. In fact, heat maps can be leveraged to drive conversions by placing an acute focus on user interaction with a page.
Within SEO, it can provide key insights into the customer experience with the website, highlighting potential issues in navigating your website or identifying which images best capture their attention. As such, heat map analysis is critical as part of a broader SEO strategy.
What is a heat map?
Heat maps first originated in the nineteenth century as 2D displays of the data values as part of a matrix, with larger values represented by dark grey pixelated squares, with smaller values being a lighter shade. In modern times, the term ‘heatmap’ was coined in the early 1990s by a software developer called Cormac Kinney, providing fast visual cues to traders working in financial markets.
From an SEO perspective, data from heat maps allow the creation of a hypothesis, such as why a user only scrolls down to a certain part of a page, and then A/B tests can be created to prove or disprove this. As a result, it has evolved into a tool which can track mouse movement, clicks and scroll depth to help understand how a user interacts with a website.
What are the different types of heat maps?
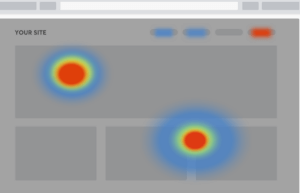
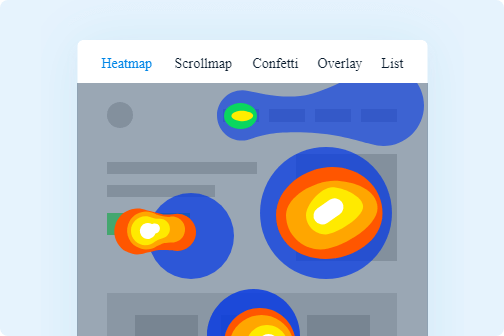
As shown, a heat map uses a colour gradient to demonstrate which page elements attract the most user attention, with the colours usually being a differing level of a warm to cool hue. Here are the top 4 most popular types of heat maps currently used
- Click heat maps
- Scroll heat maps
- Mouse tracking heat maps
- Eye tracking heat maps
Click heat maps
Click heat maps are widely used within the industry today, and they work by collecting data based on where a user clicks on your website, recording each click as a separate data point.
As shown, the more concentrated colour represents the area where a user clicks the most, with lighter colours indicating an area where less clicks are found.
They are especially useful to determine the viability of the CTA on a landing page, allowing for analysis of the conversion rate and also whether any tweaks to the website design are required from a UX perspective.
Scroll heat maps
Scroll heat maps visually display how far a user scrolls down a particular page on a website, and similar to click tracking heat maps, they would use a colour gradient to show the most viewed areas of the page and where the users ceases scrolling and abandons the page.
Scroll heat maps help CRO by determining the ideal length of a page and showing how far users scroll on the pages. This data helps to decide where to put the most important information on the overall page.
Mouse tracking heat maps
Mouse tracking heat maps, also known as hover maps, are used to place where a user has their mouse on a particular page. However, the veracity of the data extracted from such heat maps is somewhat questionable, given how a user may place their mouse on a part of the page without realising it, thus skewing potential insights into the overall user intent.
They provide a quick snapshot of the user journey within a page, and may assist in identifying conversion issues where broken links are present through non-clickable links.
Eye tracking heat maps
Eye tracking heat maps are used to track a user’s eye movements as they navigate through a landing page, with webcams being used to conduct such studies. A key consideration is the timeframe used, as a user’s behaviour within the first 3 seconds of visiting a page will be vastly different compared to the next 30 seconds, and understanding how a user navigates the page will help to interpret the date most accurately.
By placing the most important elements of a page within a user’s eye line, conversions can be maximised, and the page can be optimised in the best way possible.
What are the best heat map tools?
- Microsoft Clarity
- Hotjar
- Crazyegg
- VWO
How to use a heat map – Distinctly case study
Below is a recent case study where heat maps were used to draw out actionable insights to achieve the best results. In this particular example, we wanted to showcase our expertise within Google Analytics 4 (GA4) and how we could offer this to clients.
Insight 1: The main title of the page received the most clicks on the page, yet these were dead clicks due to the fact they did not link to any other page.
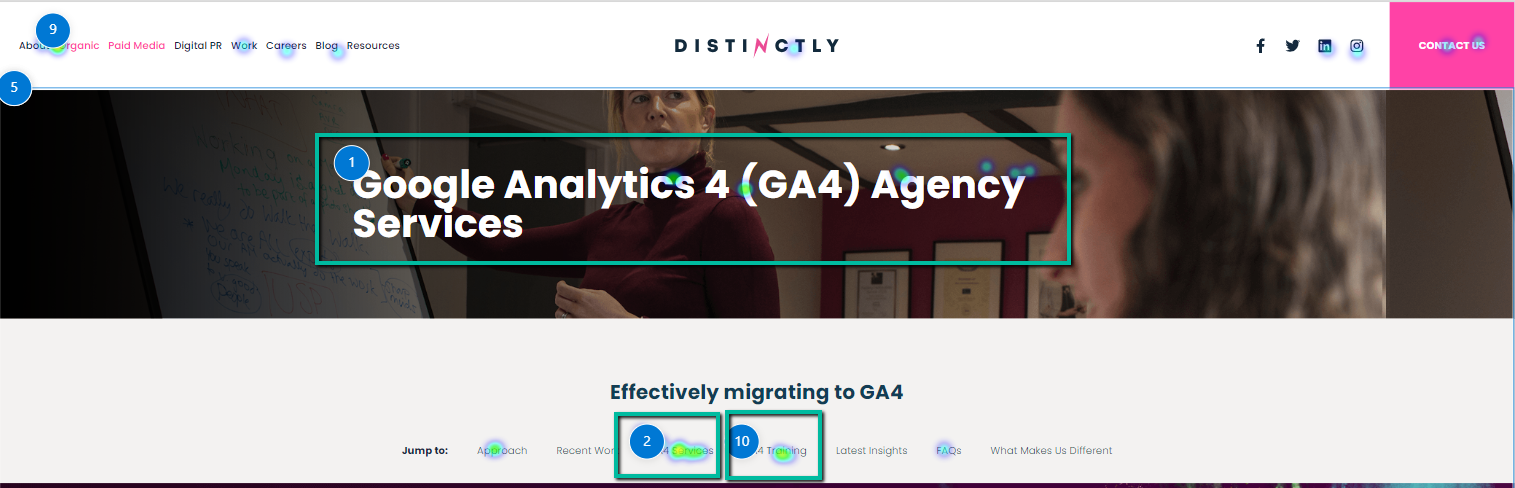
Insight 2: Through click heat maps, we could ascertain there was a keen interest amongst users in the different services we offer, however, these were also unlinked dead clicks.
In our heat map analysis, we were able to identify the following regarding the sub-headings of each section on the page:
- GA4 training – 3rd most engaging component
- GA4 setup – 4th most engaging component
- GA4 consultancy – 6th most engaging component
- Page view & event setup – not clicked on
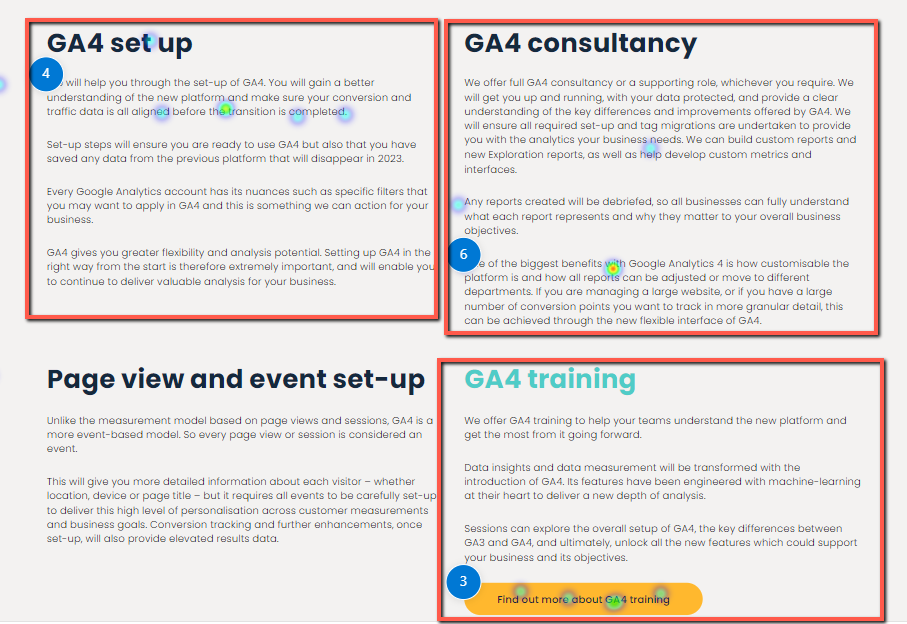
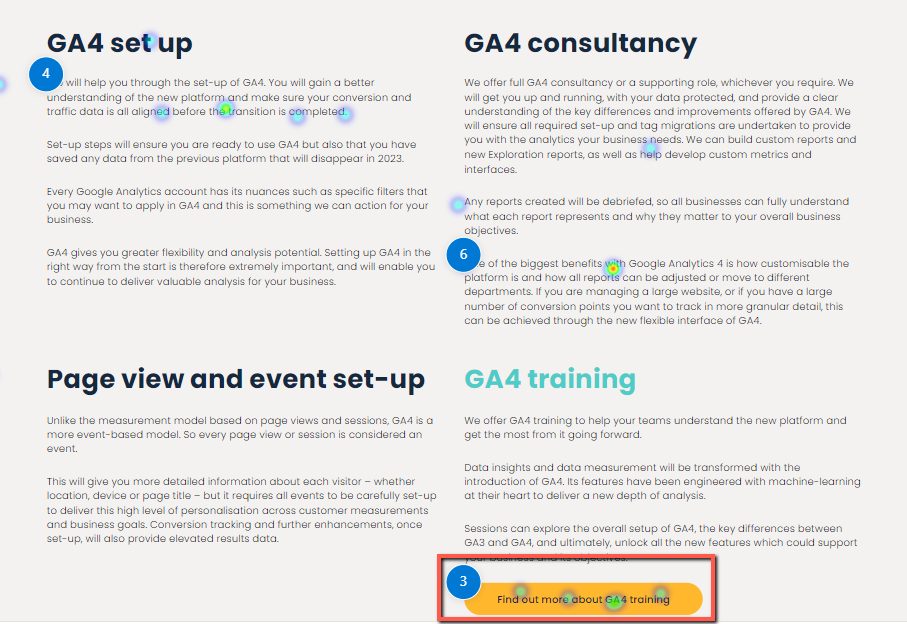
Insight 3: Users were also interested in GA4 training as a service for their company, as shown by them clicking on ‘Find Out More About GA4 Training’
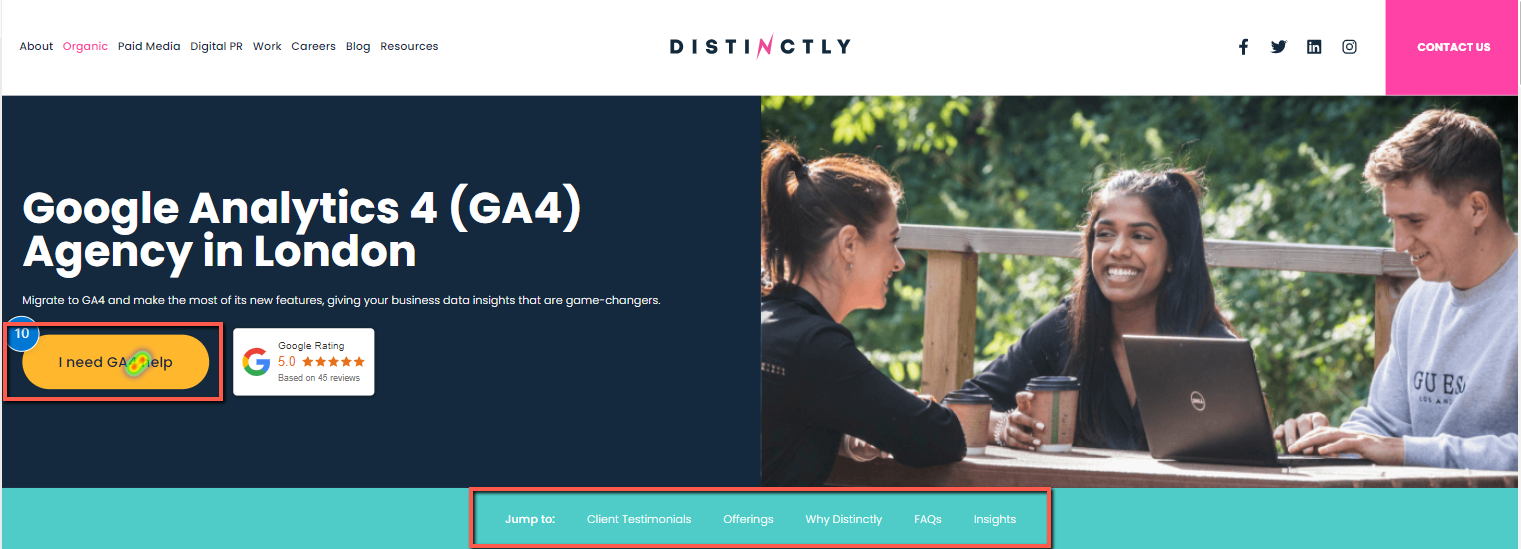
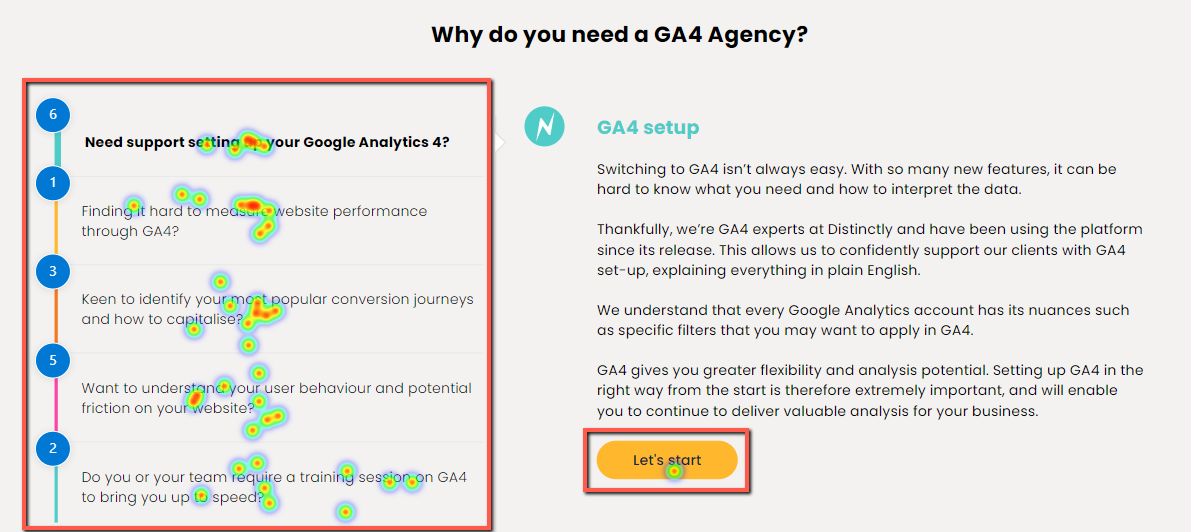
Solution 1: Our copywriting team advised on adding a clear CTA above-the-fold along with a review platform which received strong engagement and shortened the conversion funnel for users.
Solution 2: We added five different types of issues and services we provided above-the-fold, which helped to engage users on the page. We also added CTA’s to each section, ensuring there weren’t any dead clicks. We also removed any services that people were less interested in – (page view and event tracking).
Solution 3: We built a separate GA4 training page which improved our ranking from 26th to 13th in a month. This satisfied the search demand and was borne out of the heat map insights.

Heat mapping analysis is a vital part of an SEO strategy, providing a snapshot into the user experience on a webpage, allowing us to optimise the page and ultimately drive conversions. Contact us today to find out more about the SEO services we offer here.
Want cutting-edge digital news and tips straight to your inbox? Sign up to our monthly newsletter here
"*" indicates required fields